Member-only story

TL;DR
OpenAI’s new ChatGPT desktop app for macOS integrates seamlessly into your data analysis workflow with features like instant Q&A, screenshot discussion, and data extraction. I tested its capabilities in data analysis, extracting data from a complex chart, creating visualizations, and providing step-by-step guidance for tools like Tableau. The app shows great potential for enhancing productivity in various data analysis tasks.
Context
OpenAI launched its desktop App earlier this month.
“For both free and paid users, we’re also launching a new ChatGPT desktop app for macOS that is designed to integrate seamlessly into anything you’re doing on your computer. With a simple keyboard shortcut (Option + Space), you can instantly ask ChatGPT a question. You can also take and discuss screenshots directly in the app.”
I downloaded the app yesterday to try it out. At first glance, it looked like a simple replication of the web version, but I soon realized why it could effectively “integrate seamlessly into anything you’re doing on your computer.”
In the section below, I will walk you through a quick example of how to use it to assist with your data analysis work.
Extract Info from a Webpage
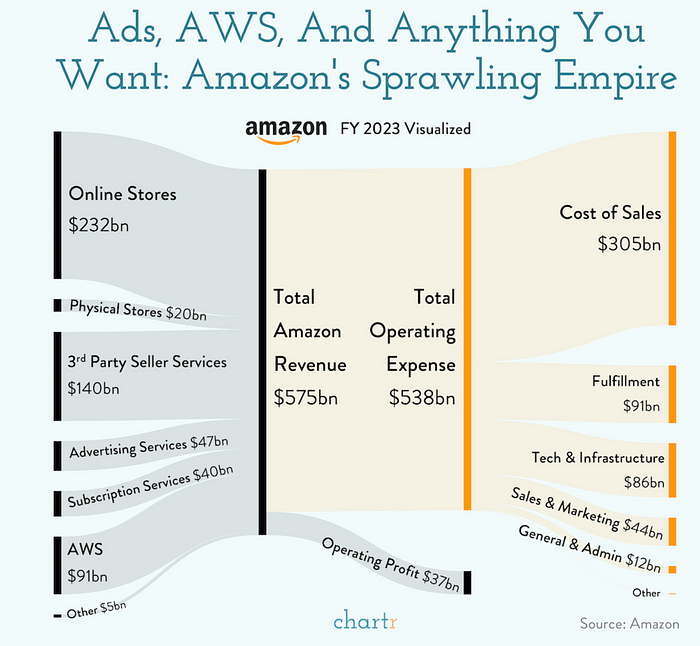
I started with a visualization of Amazon’s FY23 financial numbers from the Chartr Newsletter. It is an elegant Sankey diagram that explains the main sources of Amazon’s revenue and expenses, but not one of those common visualization types. Therefore, I decided to share it with GPT and ask it to explain the chart.

Using the keyboard shortcut (Option + Space) to open the GPT app and clicking ‘Take Screenshot’ of the browser was simple. GPT immediately provided a very accurate and detailed explanation of the chart, even highlighting key insights. I particularly liked how it called out ‘the significant role of AWS in Amazon’s financial structure.’
